














HOW OLD IS THIS HOUSE
Russia of big cities
Kon Tiki's project shows the age of buildings in the 80 largest cities of the country.


Arthur Kislitsyn
curator of how-old-is-this.house project
How-old-is-this.house project contributors
How-old-is-this.house project contributors
Alexander Kachkaev
geospatialist
Cartographer of the Penza section in how-old-is-this.house project, author of tooling for data parsing
Lera Shurupina
cartographer
Cartographer of the Kazan section in how-old-is-this.house project

Lena Panfilova
cartographer
Cartographer of the Yekaterinburg section in how-old-is-this.house project
Alexander Pronin
cartographer
Cartographer of the Vladimir section in how-old-is-this.house project

Olga Lichtenberg
cartographer
Cartographer of the Voronezh section in how-old-is-this.house project

Artemiy Skopin
cartographer
Cartographer of the Kirov section in how-old-is-this.house project
Andrey Zagoskin
cartographer
Cartographer of the Arkhangelsk, Severodvinsk and Novodvinsk section in how-old-is-this.house project
We collected available open data on buildings in the majority of large Russian cities as of 2022—when they were built, their area, floors, and other features.
For the project, we compiled a list of cities with a population exceeding 250,000 according to the 2010 census.
Below is a primary analysis of the dataset. We highlighted the most interesting findings and created interactive charts.
For the project, we compiled a list of cities with a population exceeding 250,000 according to the 2010 census.
Below is a primary analysis of the dataset. We highlighted the most interesting findings and created interactive charts.
Choose city on the map or from
CITIES LISTAbout 70 million people live in selected cities, which makes up almost half of Russia's population.
We divided the historical age line into 10 most important historical periods: pre-revolutionary, 1920s, 1930s, 1940-1956, Khrushchev, Brezhnev, Gorbachev, 1990s, 2000s, 2010s.
Late Soviet architecture shapes the appearance of most modern Russian cities, although a few exceptions can be found.
Share of total floor area (?) in each time period and city (%):
total floor area
total floor area = ground (footprint) area X number of floors
⠀⠀⠀
The rarest are the pre-revolutionary and interwar buildings, which account for a few per cent of the total in some standout cities.
The same applies to buildings from the Stalin era.
The same applies to buildings from the Stalin era.
Share of total floor area (?) for each period and city (%):

Pre-revolutionary Imperial Russia
before 1917
Top 8 cities with largest remaining total floor area of pre-revolutionary buildings:
Saint-Petersburg (46 млн м²)
Moscow (21 mln m²)
Nizhny Novgorod (2,5 mln m²)
Samara (2,3 mln m²)
Rostov-on-Don (2 mln m²)
Astrakhan (1,9 mln m²)
Saratov (1,7 mln m²)
Kazan (1,7 mln m²)
Moscow (21 mln m²)
Nizhny Novgorod (2,5 mln m²)
Samara (2,3 mln m²)
Rostov-on-Don (2 mln m²)
Astrakhan (1,9 mln m²)
Saratov (1,7 mln m²)
Kazan (1,7 mln m²)
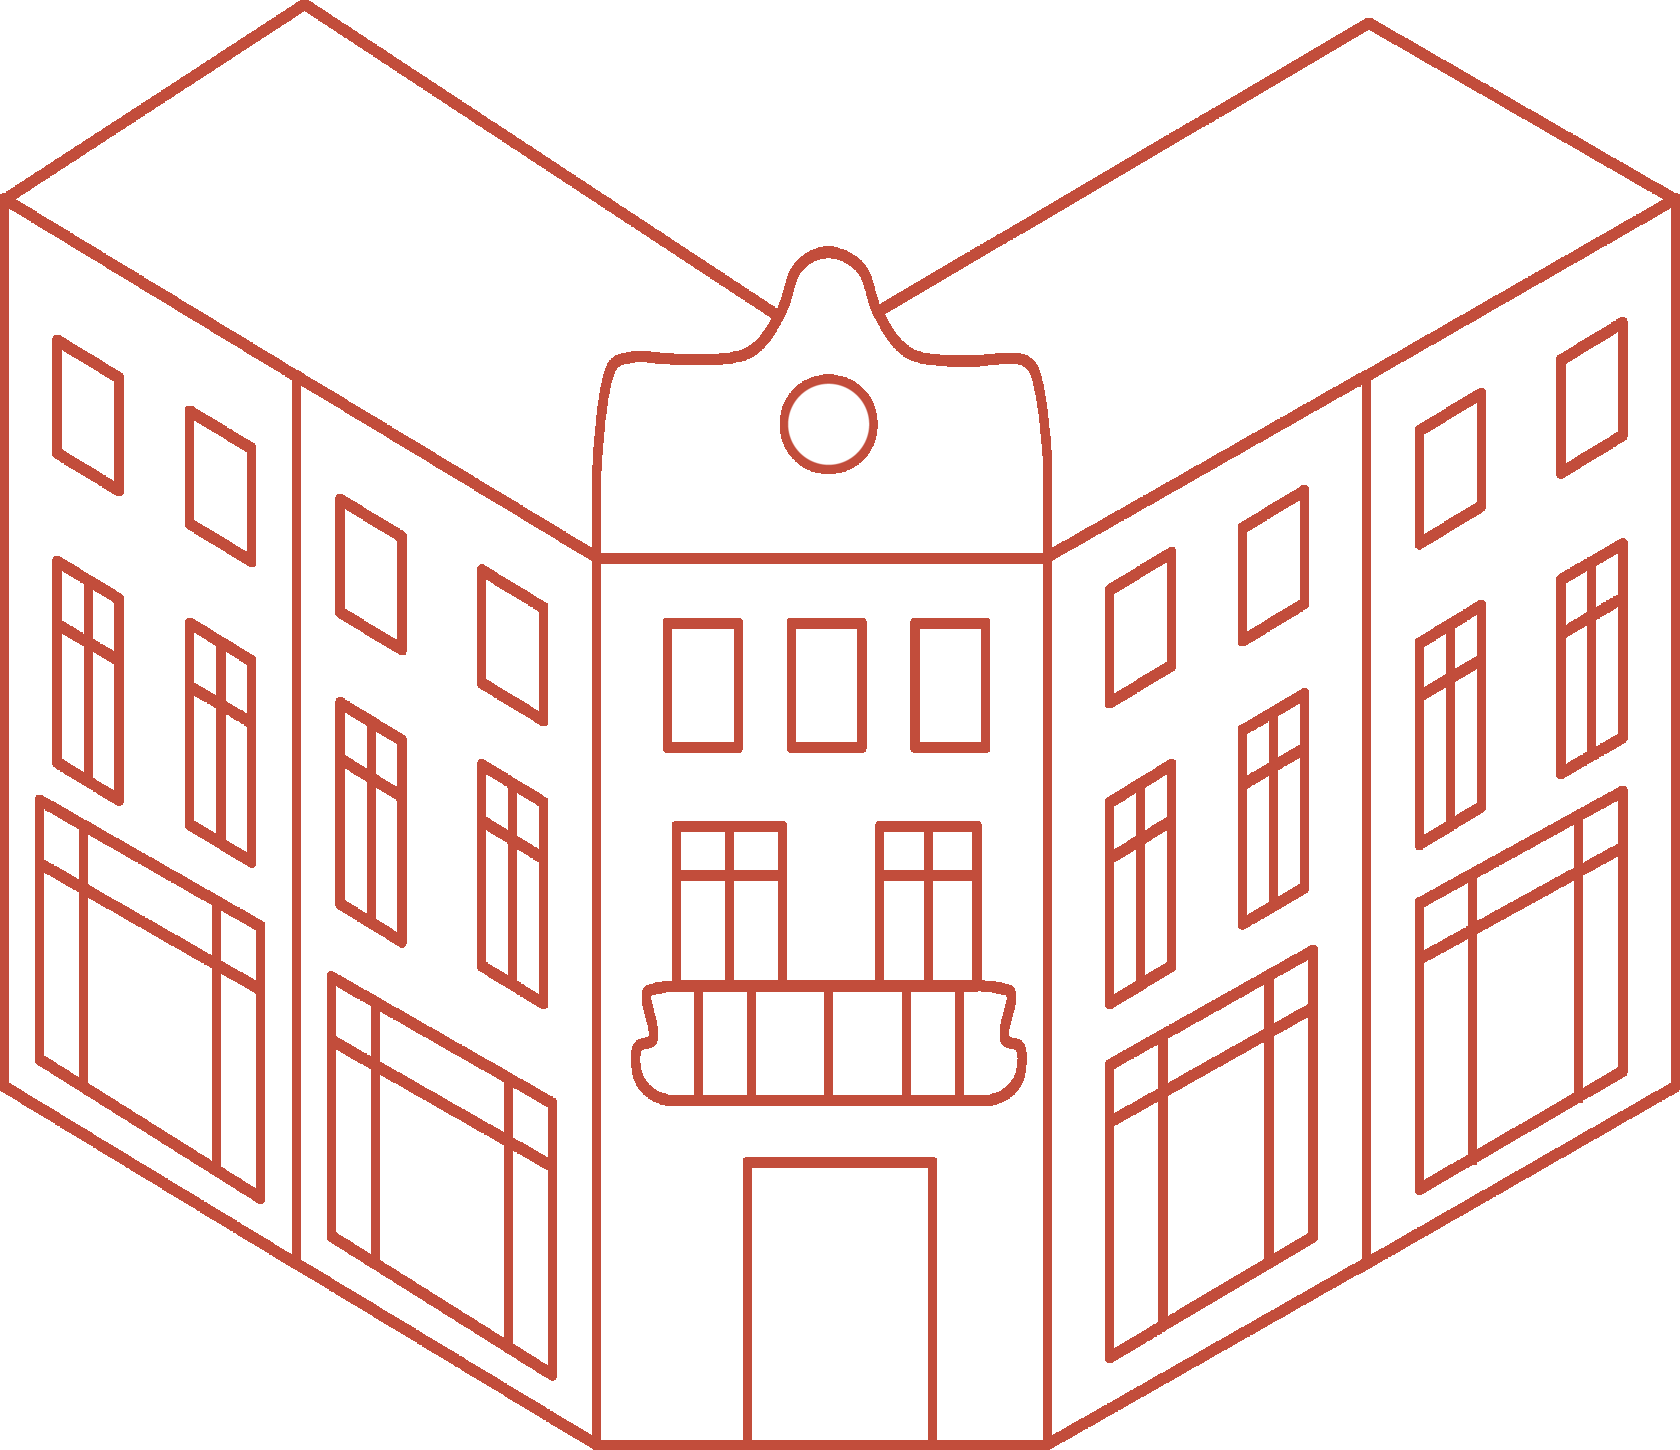
The pre-revolutionary architecture prevails in other cities.
In St. Petersburg, every 6th square meter of real estate was constructed before 1917.
In Astrakhan and Vladikavkaz, it's almost every tenth square meter.
In St. Petersburg, every 6th square meter of real estate was constructed before 1917.
In Astrakhan and Vladikavkaz, it's almost every tenth square meter.
Top 8 cities with largest share of pre-revolutionary buildings:
Saint-Petersburg (17%)
Astrakhan (8%)
Vladikavkaz (8%)
Kaliningrad (6%) **
Tomsk (5%)
Taganrog (5%)
Kostroma (5%)
Rostov-on-Don (4%)
Saratov (4%)
** The pre-revolutionary development in Kaliningrad refers to everything constructed before the end of the First World War and the revolution in Germany.
Astrakhan (8%)
Vladikavkaz (8%)
Kaliningrad (6%) **
Tomsk (5%)
Taganrog (5%)
Kostroma (5%)
Rostov-on-Don (4%)
Saratov (4%)
** The pre-revolutionary development in Kaliningrad refers to everything constructed before the end of the First World War and the revolution in Germany.
But where can you still feel the spirit of imperial Russia?
You can find it where historical districts were preserved better. We tried assessing such a feature by counting pre-revolutionary buildings with more than 75% of the pre-revolutionary building footprint area in a 100 m radius.
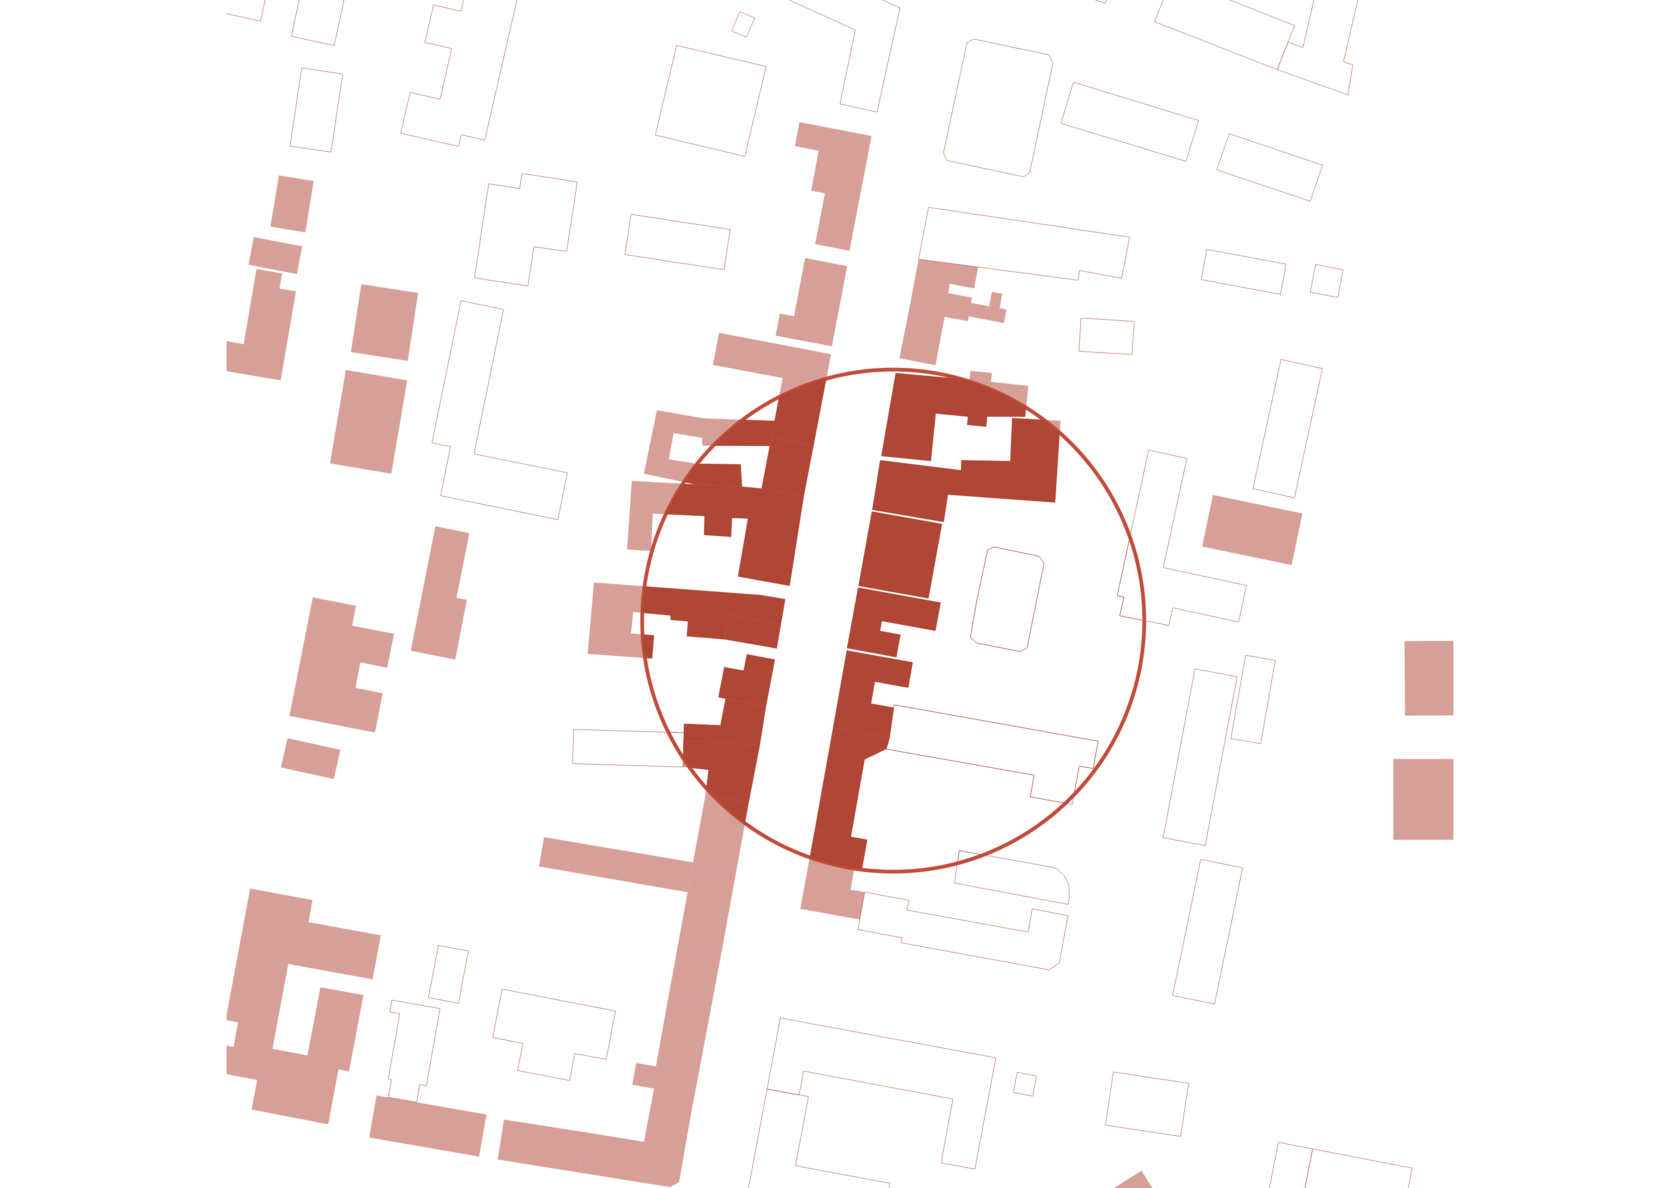
Top 8 cities with the best preserved historical environment
The number of buildings within a radius of 100 meters from which 75% of the construction footage area was built before 1917.
The number of buildings within a radius of 100 meters from which 75% of the construction footage area was built before 1917.
Saint-Peterburg (11 000)
Moscow (4500)
Nizhny Novgorod (900)
Samara (600)
Astrakhan (500)
Kaliningrad (400)
Kazan (400)
Yaroslavl (350)
Tula (300)
Moscow (4500)
Nizhny Novgorod (900)
Samara (600)
Astrakhan (500)
Kaliningrad (400)
Kazan (400)
Yaroslavl (350)
Tula (300)

Russia of Avant-garde
from 1918 to 1929
Top 8 cities with the largest total floor area of avant-garde period:
Moscow (7,6 mln m²)
Saint-Petersburg (1,8 mln m²)
Ivanovo (900 K m²)
Kaliningrad (810 K m²)
Yekaterinburg (800 K m²)
Rostov-on-Don (670 K m²)
Nizhny Novgorod (660 K m²)
– Ivanovo and Yekaterinburg took third and fifth place in the ranking. They are the cities whose avant-garde heritage is attracting increasing tourist interest nowadays.
– Kaliningrad remains fourth, where active housing construction took place during the Weimar Republic years.
– Nizhny Novgorod, ranked seventh, is known for its large worker settlements that emerged during this period.
Saint-Petersburg (1,8 mln m²)
Ivanovo (900 K m²)
Kaliningrad (810 K m²)
Yekaterinburg (800 K m²)
Rostov-on-Don (670 K m²)
Nizhny Novgorod (660 K m²)
– Ivanovo and Yekaterinburg took third and fifth place in the ranking. They are the cities whose avant-garde heritage is attracting increasing tourist interest nowadays.
– Kaliningrad remains fourth, where active housing construction took place during the Weimar Republic years.
– Nizhny Novgorod, ranked seventh, is known for its large worker settlements that emerged during this period.
Top 5 cities with the largest share of avant-garde period:
Kaliningrad (4%)
Ivanovo (4%)
Taganrog (2%)
Moscow (1,5%)
Rostov-on-Don (1,5%)
Post-revolutionary development still accounts for a significant share only in Ivanovo and Kaliningrad.
Next is Taganrog, where numerous individual estate houses appeared in the 1920s, followed by Moscow and Rostov-on-Don.
Ivanovo (4%)
Taganrog (2%)
Moscow (1,5%)
Rostov-on-Don (1,5%)
Post-revolutionary development still accounts for a significant share only in Ivanovo and Kaliningrad.
Next is Taganrog, where numerous individual estate houses appeared in the 1920s, followed by Moscow and Rostov-on-Don.
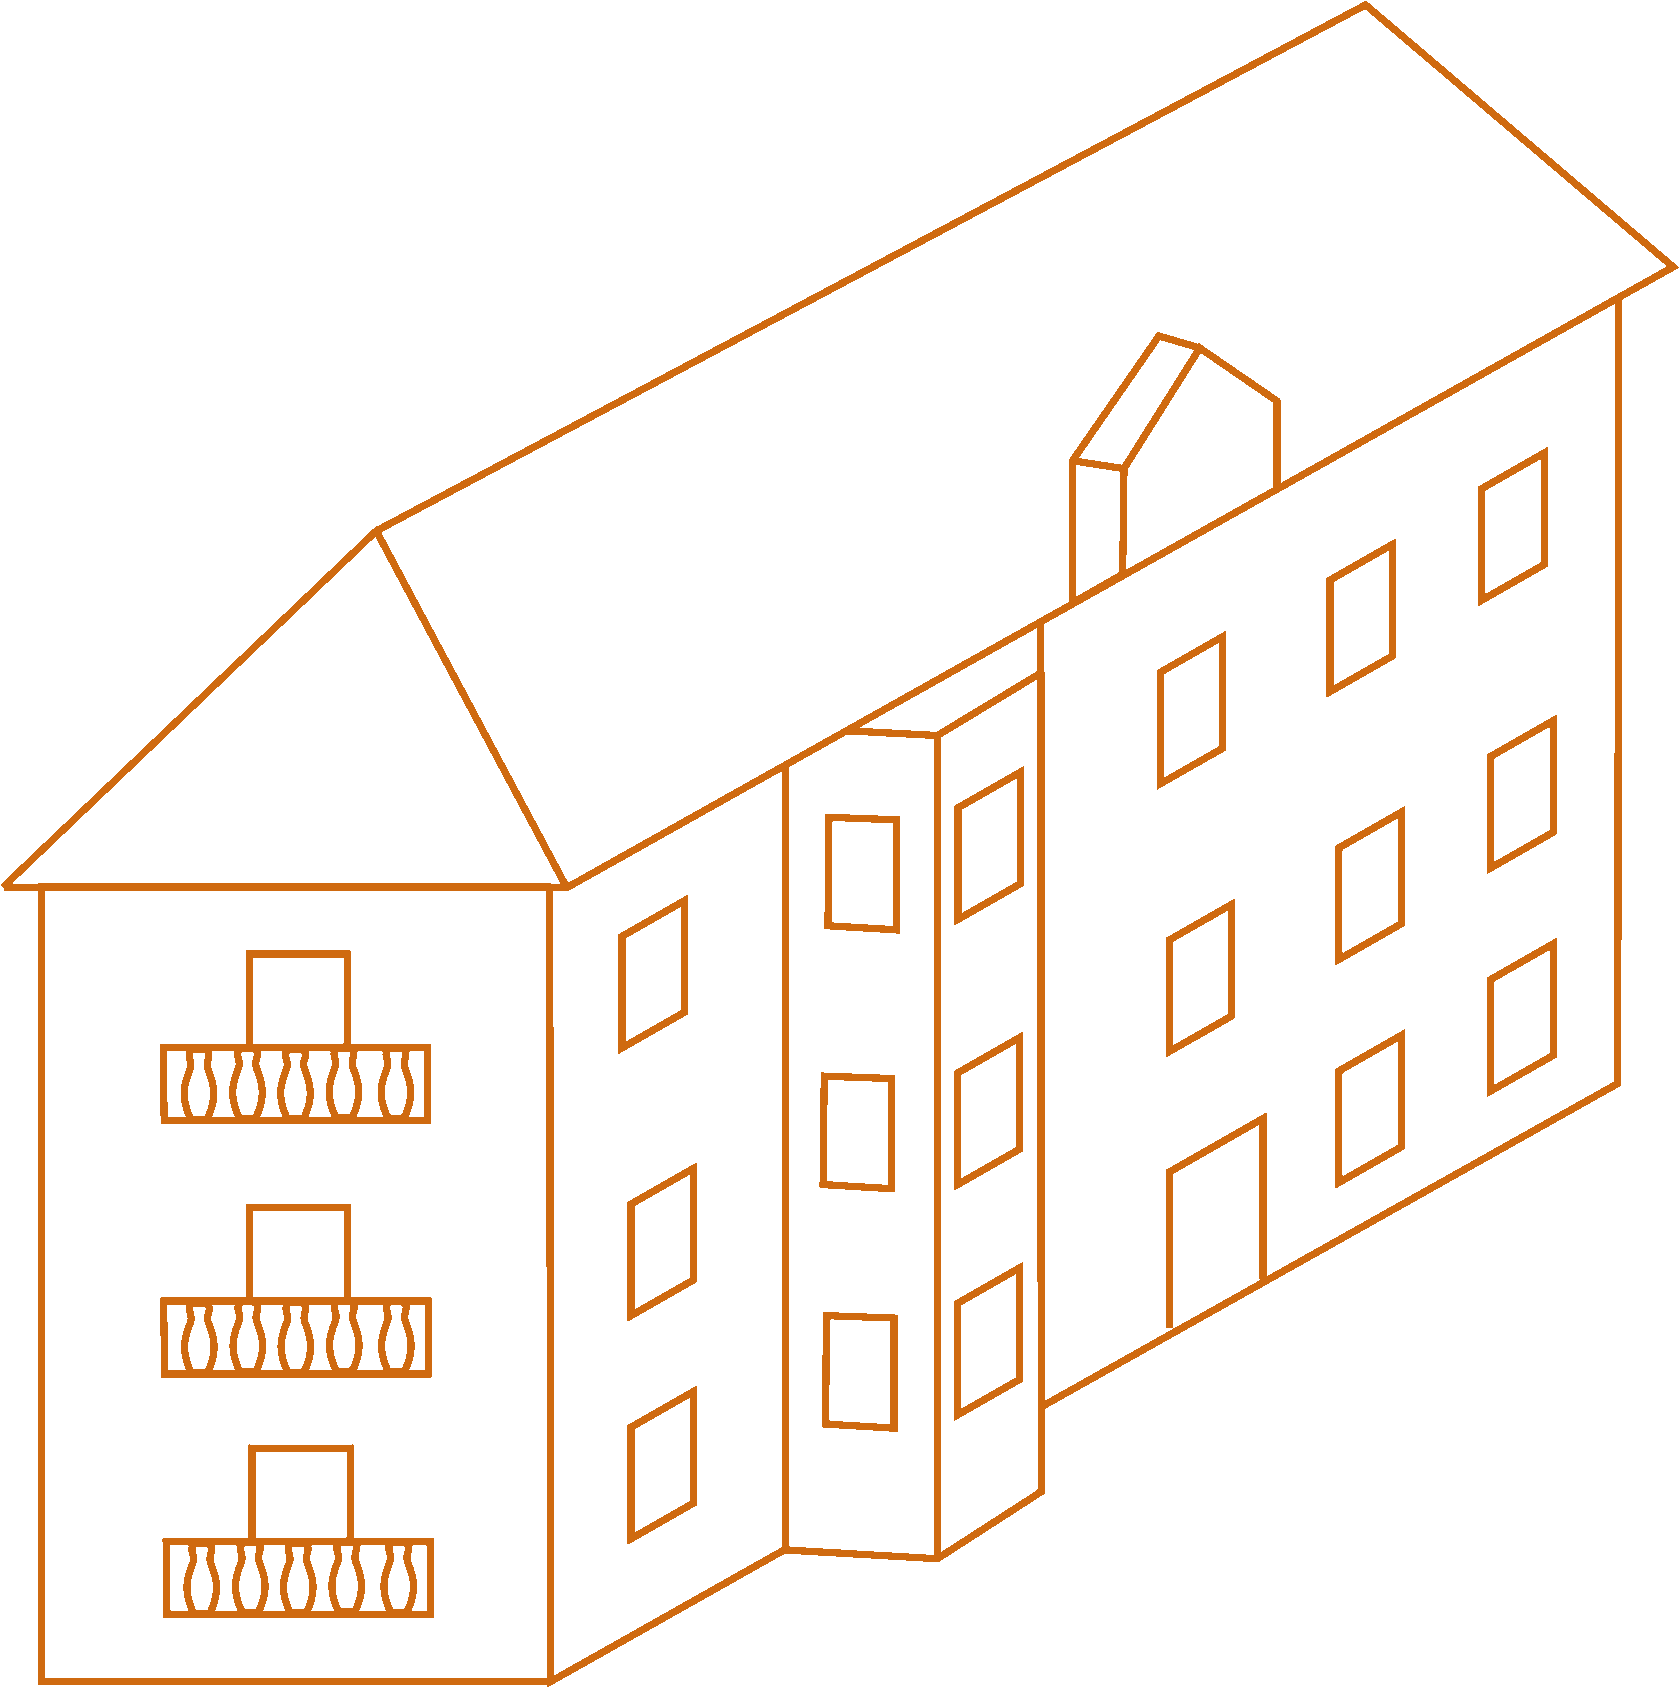
Russia of the 1930s
from 1930 to 1939
Top 6 cities with larges total floor area of the 1930s buildings:
Moscow (18 mln m²)
Saint-Petersburg (7,8 mln m²)
Nizhny Novgorod (4,6 mln m²)
Novosibirsk (1,8 mln m²)
Yekaterinburg (1,3 mln m²)
Samara (1,3 mln m²)
Saint-Petersburg (7,8 mln m²)
Nizhny Novgorod (4,6 mln m²)
Novosibirsk (1,8 mln m²)
Yekaterinburg (1,3 mln m²)
Samara (1,3 mln m²)
During these years, most buildings were erected in Moscow, where the reconstruction of the city centre began, as well as in St. Petersburg and Nizhny Novgorod – a major industrial centre of the USSR in the 1930s. Novosibirsk appears on the diagrams for the first time, as its active growth began precisely during this period.
Top 8 cities with the largest share of 1930s buildings:
Nizhny Novgorod (6%)
Arkhangelsk (5%)
Ulan-Ude(4%)
Taganrog (4%)
Ivanovo (4%)
Murmansk (3%)
Moscow (3%)
Saint-Petersburg (3%)
Arkhangelsk (5%)
Ulan-Ude(4%)
Taganrog (4%)
Ivanovo (4%)
Murmansk (3%)
Moscow (3%)
Saint-Petersburg (3%)
Early Stalinist architecture still largely defines the appearance of the city centres of Nizhny Novgorod (more than 5%), Arkhangelsk, Ivanovo, Ulan-Ude, Moscow, and Murmansk. In Taganrog, estate-style houses were still being actively constructed in the 1930s.
War and after-war Russia
from 1940 to 1956
Late Stalinist architecture constitutes more than 10% of the buildings in Magnitogorsk and Nizhny Tagil – major industrial centres in the Urals. Also in the top ten are Volgograd, Novokuznetsk, Samara, Chelyabinsk, Ivanovo, Petrozavodsk, Bryansk, and Kemerovo.
Top 12 cities with the largest total floor area of war and after-war Russia:
Magnitogorsk (11%)
Nizhny Tagil (10,5%)
Volgograd (10%)
Novokuznetsk (8%)
Samara (7%)
Chelyabinsk (6%)
Ivanovo (6%)
Petrozavodsk (6%)
Bryansk (6%)
Kemerovo (6%)
Taganrog (6%)
Voronezh (6%)
Over the 26 years (1930-1956), the largest amount of Stalinist architecture in Russia can be found in Moscow, St. Petersburg, Volgograd, Nizhny Novgorod, Samara, Yekaterinburg, Novosibirsk, Perm, Chelyabinsk, and Omsk.
Nizhny Tagil (10,5%)
Volgograd (10%)
Novokuznetsk (8%)
Samara (7%)
Chelyabinsk (6%)
Ivanovo (6%)
Petrozavodsk (6%)
Bryansk (6%)
Kemerovo (6%)
Taganrog (6%)
Voronezh (6%)
Over the 26 years (1930-1956), the largest amount of Stalinist architecture in Russia can be found in Moscow, St. Petersburg, Volgograd, Nizhny Novgorod, Samara, Yekaterinburg, Novosibirsk, Perm, Chelyabinsk, and Omsk.
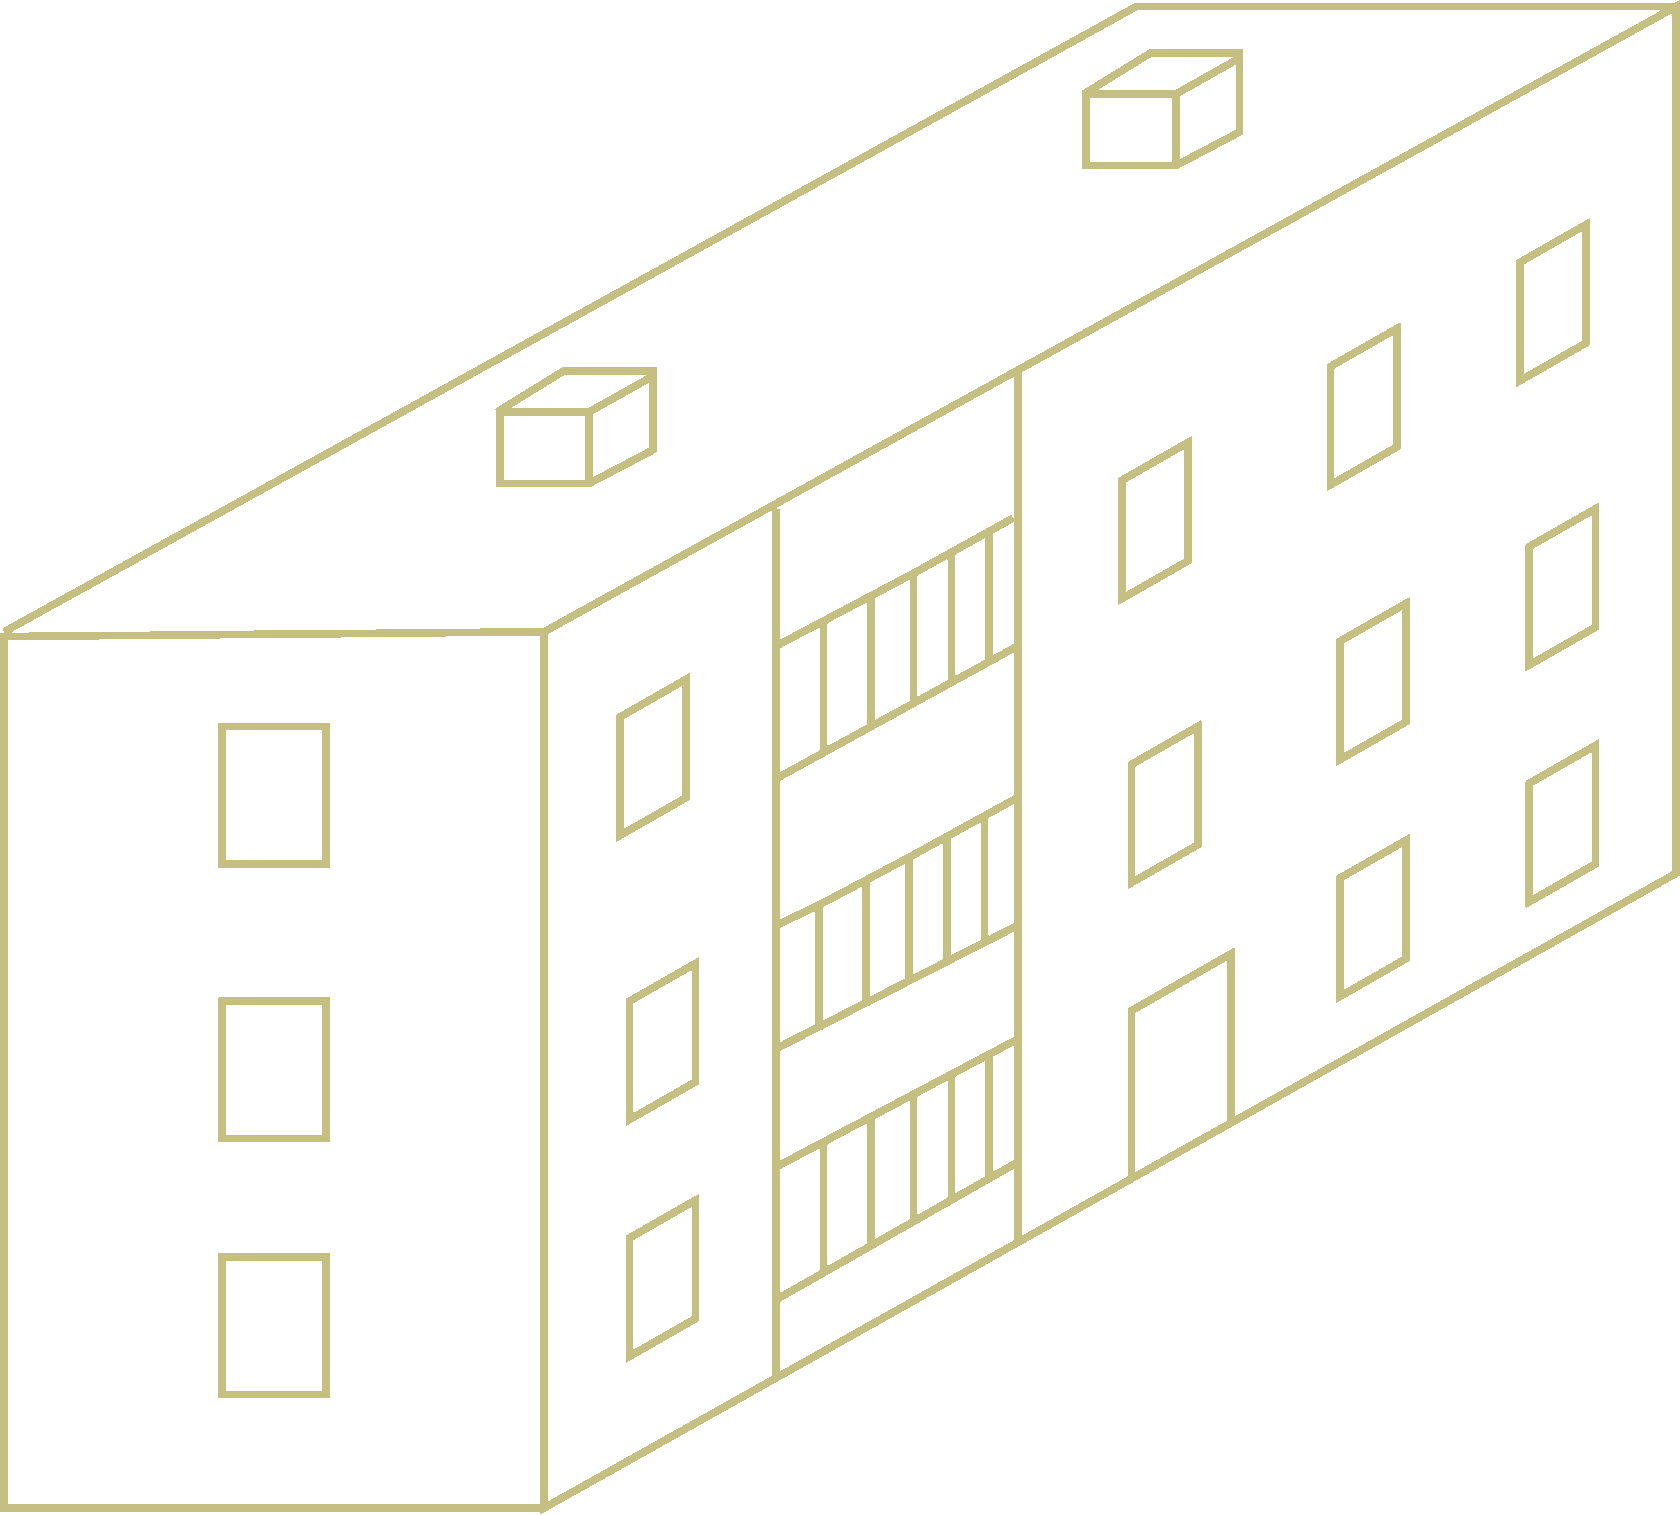
Khrushchev Russia
from 1957 to 1964
Top 8 cities with the largest share of khrushchev period:
Novokuznetsk (17%)
Volgograd (15%)
Tula (14%)
Nizhny Tagil (14%)
Murmansk (12%)
Magnitogorsk (12%)
Sterlitamak (12%)
Kemerovo (12%)
Volgograd (15%)
Tula (14%)
Nizhny Tagil (14%)
Murmansk (12%)
Magnitogorsk (12%)
Sterlitamak (12%)
Kemerovo (12%)
As expected, most of these buildings are in Moscow and St. Petersburg. Among the top five leaders are also Nizhny Novgorod (where the Gorky method – people's construction – originated in 1957), Perm, and Yekaterinburg.
Today, Khrushchyovka construction occupies the largest share of the industrial power in cities whose industrial power grew in the 1960s—Novokuznetsk, Volgograd, Tula, and Nizhny Tagil.
Today, Khrushchyovka construction occupies the largest share of the industrial power in cities whose industrial power grew in the 1960s—Novokuznetsk, Volgograd, Tula, and Nizhny Tagil.
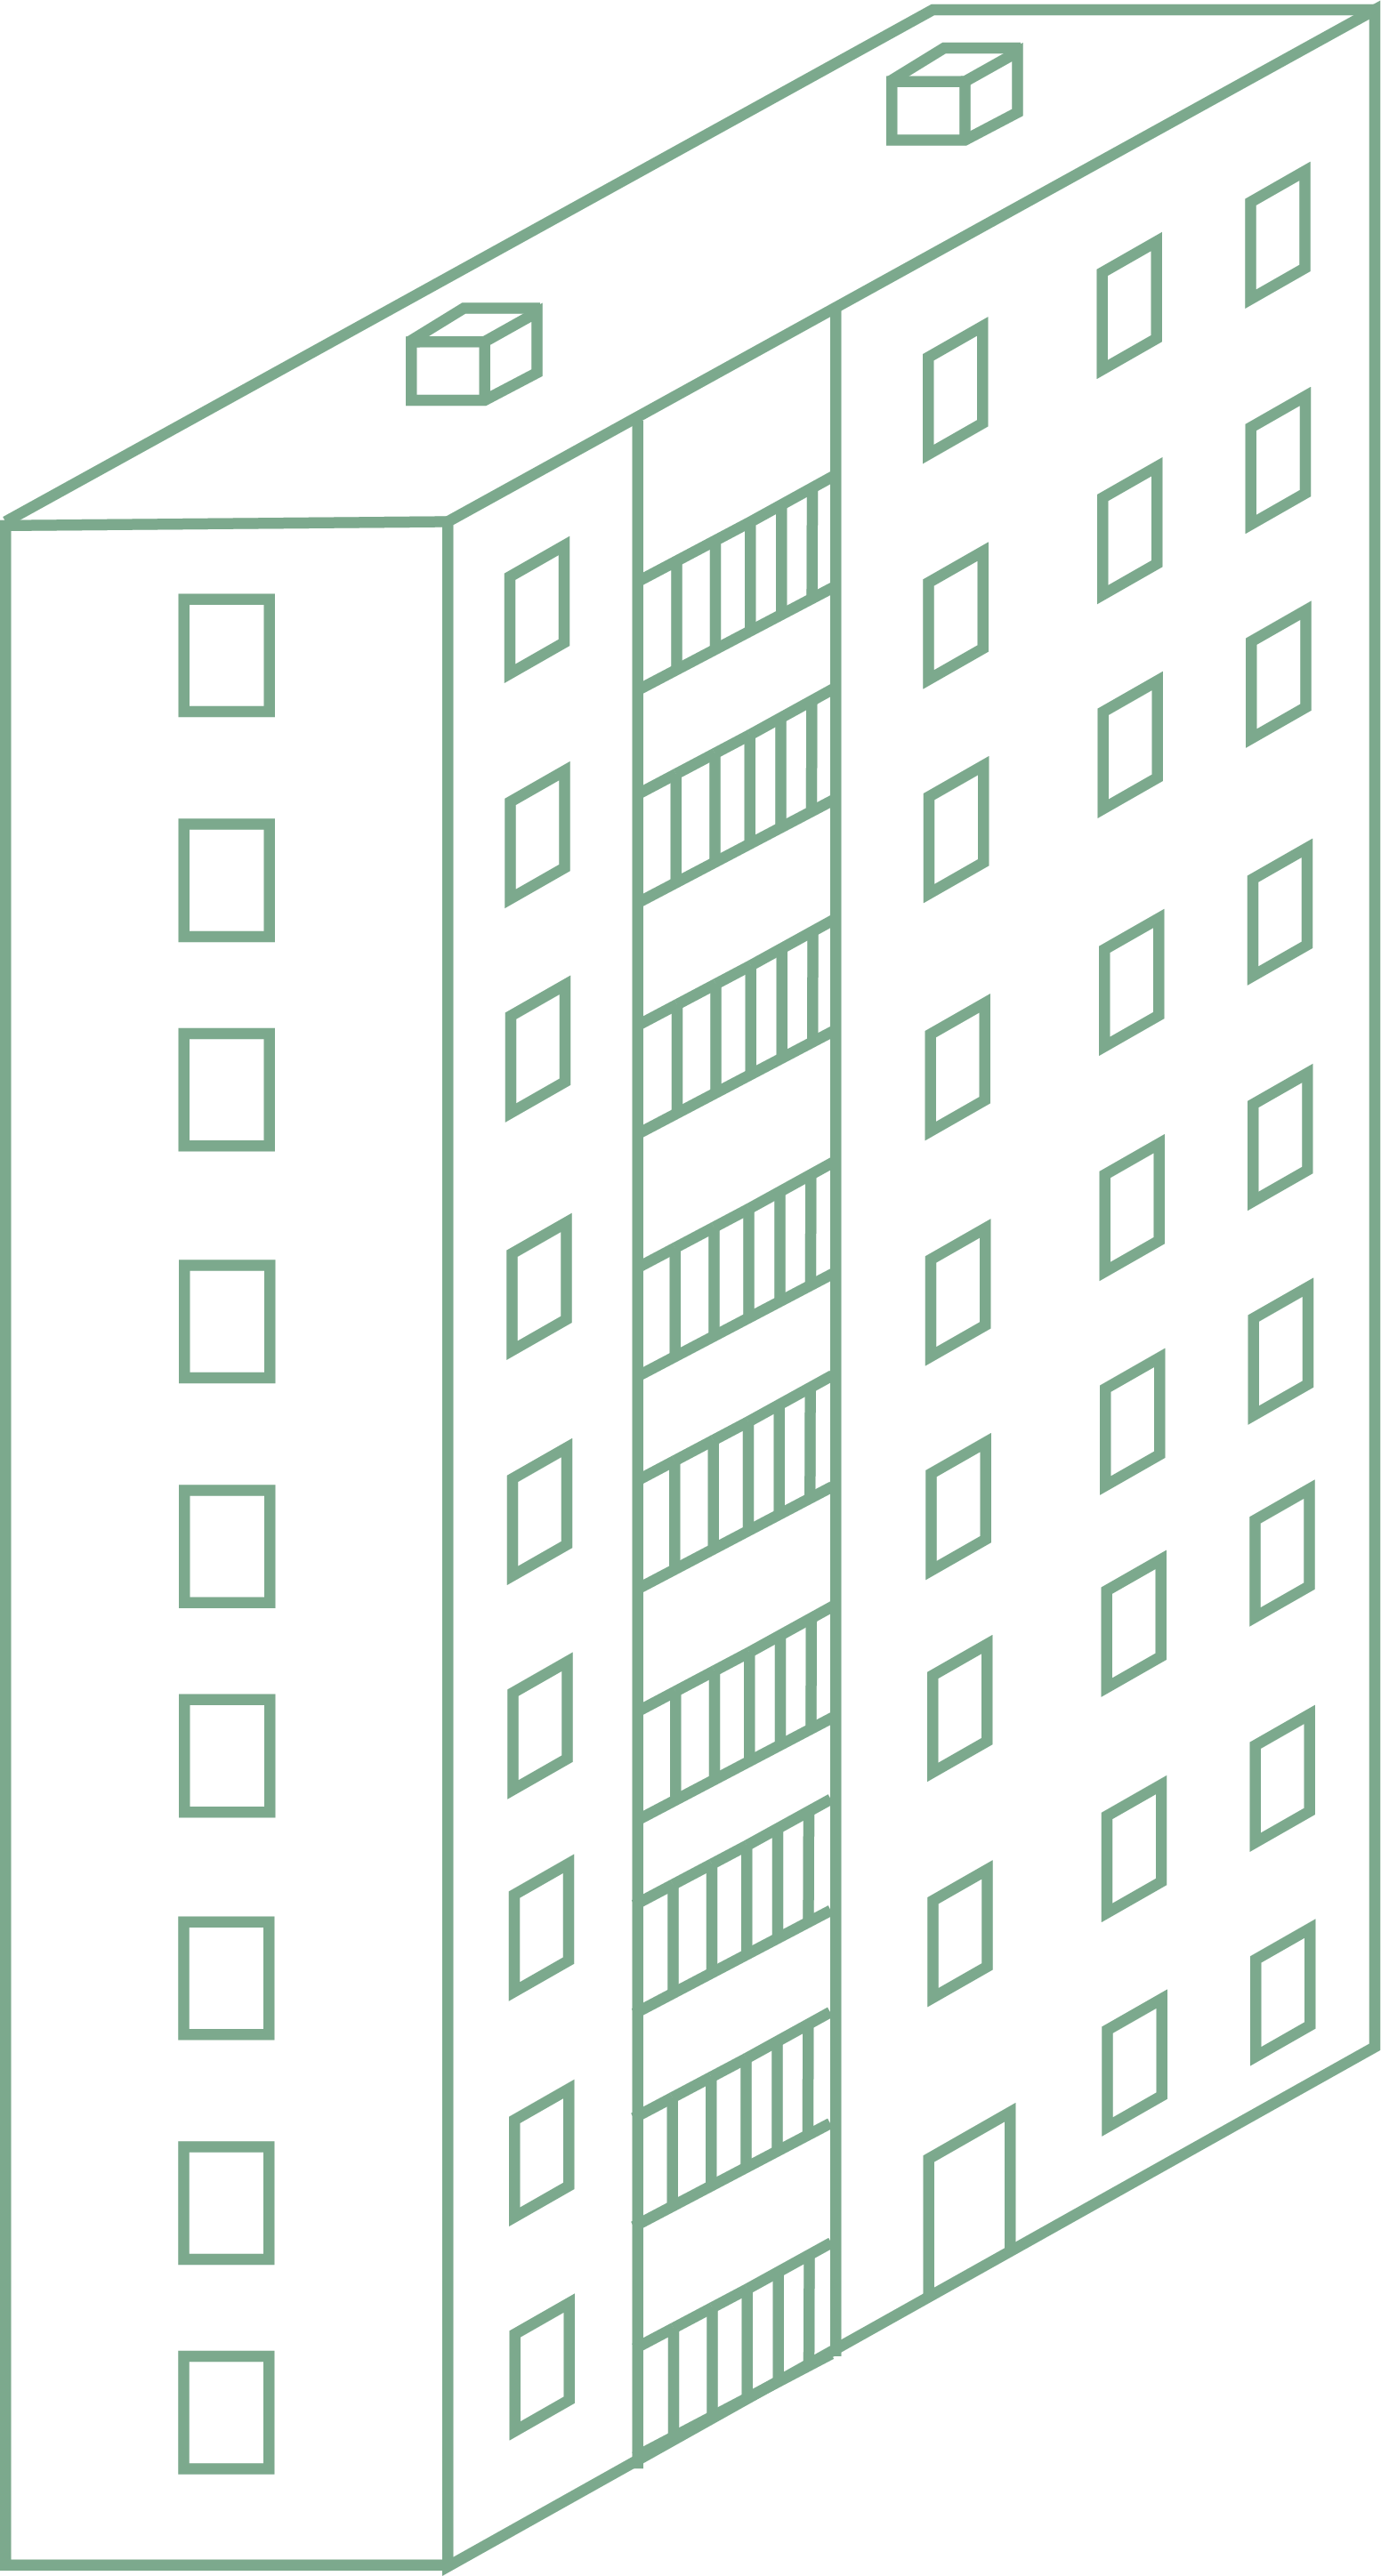
Brezhnev Russia and the era of stagnation
from 1965 to 1985
Top 8 cities with the largest share of Brezhnev period:
Murmansk (54%)
Kurgan (46%)
Naberezhnye Chelny (45%)
Volzhsky (44%)
Arkhangelsk (42%)
Nizhny Tagil (41%)
Vladimir (40%)
Cherepovets (39%)
Kurgan (46%)
Naberezhnye Chelny (45%)
Volzhsky (44%)
Arkhangelsk (42%)
Nizhny Tagil (41%)
Vladimir (40%)
Cherepovets (39%)
More than half of all construction in Murmansk consists of buildings from 1965 to 1985.
A very high proportion is also found in Kurgan, Naberezhnye Chelny, Togliatti (both major late Soviet centres of automobile manufacturing, where a new modernist city-mega district emerged), Volzhsky, Arkhangelsk, Nizhny Tagil, and Vladimir.
A very high proportion is also found in Kurgan, Naberezhnye Chelny, Togliatti (both major late Soviet centres of automobile manufacturing, where a new modernist city-mega district emerged), Volzhsky, Arkhangelsk, Nizhny Tagil, and Vladimir.
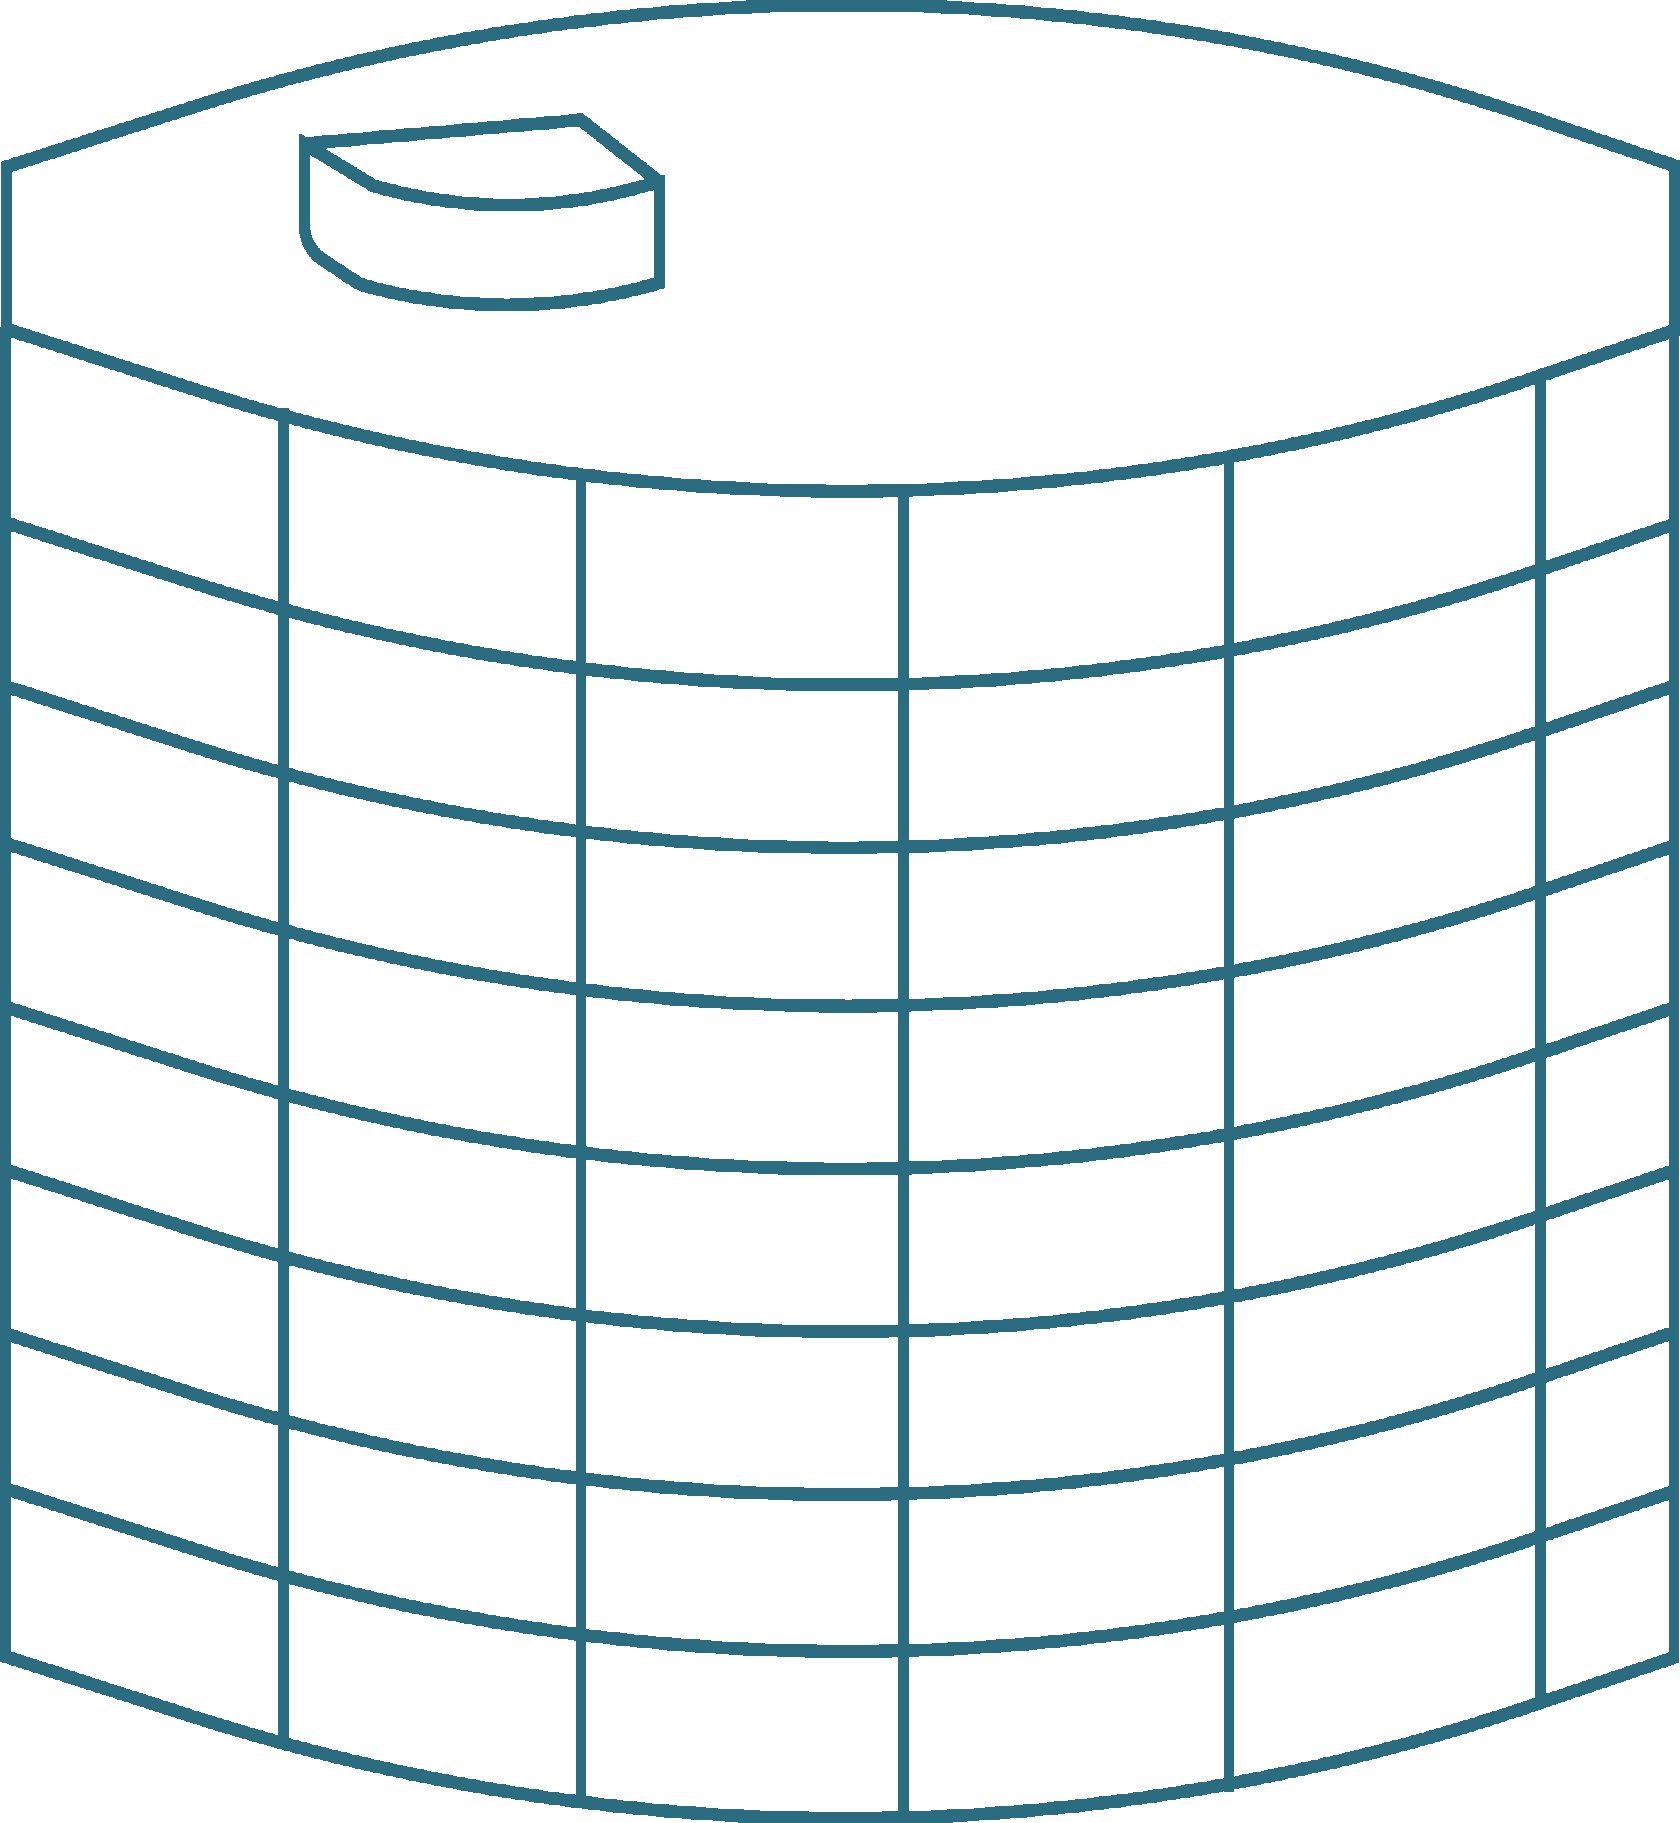
Post-Perestroika Russia
from 1991 to 1999
Top 8 cities with the largest share of post-Perestroika period (1991-1999):
Cheboksary (13%)
Belgorod (13%)
Lipetsk (12%)
Yakutsk (12%)
Yoshkar-Ola (12%)
Surgut (12%)
Tolyatti (12%)
Vologda (11%)
Belgorod (13%)
Lipetsk (12%)
Yakutsk (12%)
Yoshkar-Ola (12%)
Surgut (12%)
Tolyatti (12%)
Vologda (11%)
The post-perestroika era significantly influenced the appearance of cities in Cheboksary (where active population growth was observed), Belgorod, Lipetsk, Yakutsk, Yoshkar-Ola, Surgut, Togliatti, and Vologda.
In the 1990s, every tenth square meter of real estate was constructed in Voronezh, Tver, Bryansk, Tyumen, Stavropol, Oryol, Chita, and Kazan.
In the 1990s, every tenth square meter of real estate was constructed in Voronezh, Tver, Bryansk, Tyumen, Stavropol, Oryol, Chita, and Kazan.
Russia of 2000s
from 2000 to 2009
Top 12 cities with the largest share of 2000s period:
Kazan (28%)
Khimki (25%)
Balashikha (22%)
Stavropol (20%)
Belgorod (20%)
Saint-Petersburg (19%)
Yakutsk (19%)
Tyumen (19%)
Kaliningrad (18%)
Podolsk (18%)
Tomsk (18%)
Grozny (18%)
Khimki (25%)
Balashikha (22%)
Stavropol (20%)
Belgorod (20%)
Saint-Petersburg (19%)
Yakutsk (19%)
Tyumen (19%)
Kaliningrad (18%)
Podolsk (18%)
Tomsk (18%)
Grozny (18%)
This era left the most noticeable impact on Kazan, the Moscow suburbs of Khimki, Balashikha, Podolsk, Stavropol, Belgorod, St. Petersburg, Yakutsk, Tyumen, Grozny, Kaliningrad, and Tomsk. In these cities, approximately every fifth to the sixth square meter was built 15-20 years ago, and every fourth square meter in the centre of the Tatarstan region!
Russia of 2010s
from 2010 to 2020
Top 9 cities with the largest share of 2010s period:
Krasnodar (55%)
Sochi (47%)
Makhachkala (44%)
Balashikha (43%)
Novorossiysk (41%)
Khimki (40%)
Tyumen (37%)
Stavropol (36%)
Surgut (35%)
Sochi (47%)
Makhachkala (44%)
Balashikha (43%)
Novorossiysk (41%)
Khimki (40%)
Tyumen (37%)
Stavropol (36%)
Surgut (35%)
Over half of the buildings in Krasnodar were constructed in the last decade. In Sochi, Makhachkala, Balashikha, and Novorossiysk, the share of the total area of new buildings exceeds 40%.
Post-Soviet construction, as expected, makes up gigantic shares in the mentioned cities.
Particularly noteworthy are the cities where two out of three or every second square meter of real estate was built after 1991.
Particularly noteworthy are the cities where two out of three or every second square meter of real estate was built after 1991.
Top 15 cities with the largest share of 1991-2020 period:
Krasnodar (75%)
Khimki (70%)
Balashikha (69%)
Sochi (68%)
Tyumen (66%)
Makhachkala (66%)
Stavropol (66%)
Yakutsk (64%)
Surgut (63%)
Novorossiysk (59%)
Kaliningrad (55%)
Podolsk (54%)
Kazan (54%)
Belgorod (52%)
Novosibirsk (51%)
Khimki (70%)
Balashikha (69%)
Sochi (68%)
Tyumen (66%)
Makhachkala (66%)
Stavropol (66%)
Yakutsk (64%)
Surgut (63%)
Novorossiysk (59%)
Kaliningrad (55%)
Podolsk (54%)
Kazan (54%)
Belgorod (52%)
Novosibirsk (51%)
Where do Russians live?
In the largest cities, every third resident lives in a five—or nine-storey building from the Khrushchev or Brezhnev era.
The five-story apartment buildings from the 1960s still remain the most common type of housing.
The five-story apartment buildings from the 1960s still remain the most common type of housing.
At the same time, there is an interesting exception to pre-revolutionary buildings. Almost every fifth square meter in the multi-apartment buildings of St. Petersburg was constructed before 1917. Such indicators are not even close to any other city in Russia (in Moscow, it's just slightly over one percent).
– In Astrakhan, Rostov-on-Don, and Vladikavkaz, almost 5% of housing is from the pre-revolutionary period.
– In Kaliningrad, the pre-war German residential stock (before 1945) collectively makes up more than 10%.
– In Astrakhan, Rostov-on-Don, and Vladikavkaz, almost 5% of housing is from the pre-revolutionary period.
– In Kaliningrad, the pre-war German residential stock (before 1945) collectively makes up more than 10%.
Top 12 cities with the largest share of pre-revolutionary housing:
Saint-Petersburg (17%)
Astrakhan (4%)
Rostov-on-Don (4%)
Vladikavkaz (4%)
Kaliningrad (3%)
Kostroma (3%)
Tomsk (3%)
Tambov (3%)
Makhachkala (2,5%)
Saratov (2,5%)
Chita (2,5%)
Samara (2,5%)
Astrakhan (4%)
Rostov-on-Don (4%)
Vladikavkaz (4%)
Kaliningrad (3%)
Kostroma (3%)
Tomsk (3%)
Tambov (3%)
Makhachkala (2,5%)
Saratov (2,5%)
Chita (2,5%)
Samara (2,5%)
P.S.
Our data is open and available as an online map or could be downloaded. We hope that it will be useful to a wide audience and that many interesting insights can be caught from it, despite the presence of some inaccuracies.
The analysis in this article represents a preliminary examination, just an attempt to explore the dataset. It has its limitations and issues, which I have described in detail in the article about the entire collection and processing.
I would be happy to receive comments and feedback!
The analysis in this article represents a preliminary examination, just an attempt to explore the dataset. It has its limitations and issues, which I have described in detail in the article about the entire collection and processing.
I would be happy to receive comments and feedback!
I want to say thank you to:
– Sasha Kachkaev – for the idea of the all-Russian wonder script, its development and implementation, for supporting the code and me throughout the entire data collection process;
– the team of Geosemantica — for their invaluable technical assistance in collecting data and their fantastic data web visualization skills;
– all the authors of the 14 age maps of buildings, whose experience laid the foundation for the all-Russian project;
– Nikita Slavin – for founding the project and supporting it every step of the way.
– Sasha Kachkaev – for the idea of the all-Russian wonder script, its development and implementation, for supporting the code and me throughout the entire data collection process;
– the team of Geosemantica — for their invaluable technical assistance in collecting data and their fantastic data web visualization skills;
– all the authors of the 14 age maps of buildings, whose experience laid the foundation for the all-Russian project;
– Nikita Slavin – for founding the project and supporting it every step of the way.